What is turbidity and why is it important?
The following background information was directly obtained or modified from the Environmental Protection Agency’s website on turbidity.
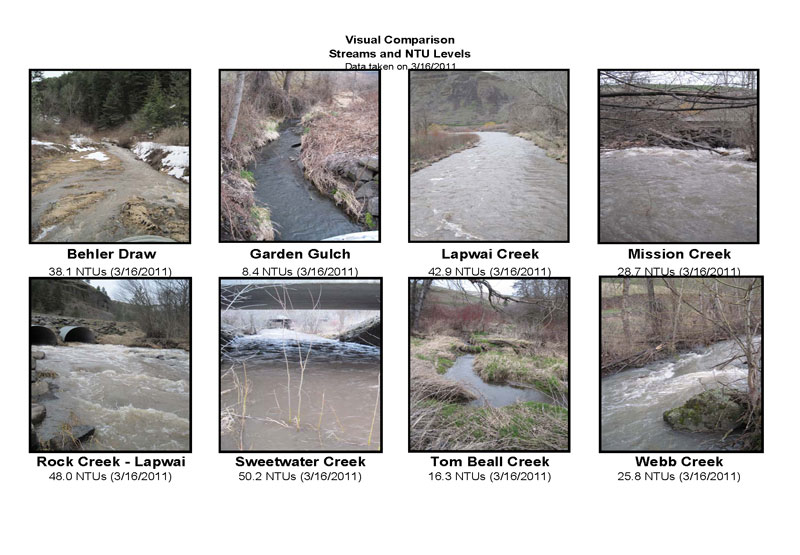
Turbidity is the measure of how much transparency water loses due to the presence of suspended particulates, and is an indicator of the suspended sediment load carried by a stream. Turbidity is a measure of the water’s clarity. It is determined by measuring the how much the suspended material in water decreases the passage of light through water. Suspended materials include soil particles which is why this measurement is used as an indicator of water quality. Turbidity can be useful as an indicator of the effects of runoff from construction, agricultural practices, logging activity, and other discharges. Turbidity can affect the color of the water as illustrated in the visual sample comparison collected in March 2011 and shown in the figure below.
Higher turbidity increases water temperature because suspended particles absorb more heat. This in turn reduces the concentration of dissolved oxygen (DO) because warm water holds less DO than cold water. In addition, the amount of light penetrating the water body is decreased, reducing photosynthesis and the production of DO. As particles settle, they can cover the stream bottom and smother eggs and benthic macroinvertebrates. Sources of turbidity include:
- Soil erosion
- Road runoff
- Eroding stream banks
Turbidity is measured using a meter which consists of a light source that illuminates the water sample and a photoelectric cell that measures the intensity of light scattered at a 90 degree angle by the particles in the sample. Measurements are made in nephelometric turbidity units or NTUs. Regular monitoring of turbidity can help detect trends that might indicate increasing erosion in developing watersheds. As turbidity is closely related to stream flow and velocity comparisons of the change in turbidity over time should be made at the same point in time.
Turbidity Standards:
The Idaho Department of Environmental Quality Guide to Selection of Sediment Targets for use in Idaho TMDLs presents a range for turbidity concentrations based on research and available literature. Idaho Water Quality Standards state that turbidity concentrations are not to exceed 50 NTU instantaneous or 25 NTU continuous for 10 days above baseline background turbidity levels. The research shows that juvenile steelhead begin to exhibit altered behaviors like emigration/avoidance and even reduced growth rates in concentrations as low as 25 NTU. For watershed management and fish habitat purposes, the District has selected a goal of all waters within the District are less than 25 NTUs.
The District’s turbidity monitoring program:
The District measures turbidity in order to collect baseline information and establish trends. This data is used to assist the District in identifying areas that exceed water quality standards and provides data used in prioritization and project effectiveness evaluations. The District collects turbidity at 42 locations on a regular occurring basis. The District collects turbidity data on a county wide basis as well as special emphasis monitoring for two watersheds: Lapwai and Tammany Creek. Sampling at these sites is generally completed on a monthly basis with data compiled on an annual basis. Data summaries and results are described below.
All turbidity monitoring is completed according to the Turbidity Field Measurement Standard Operating Procedure (NPSWCD, 2013) unless otherwise stated.
Data results for the current monitoring year are posted as they are validated. This raw data has not been summarized or analyzed and is provided for educational purposes.
COUNTY WIDE MONITORING
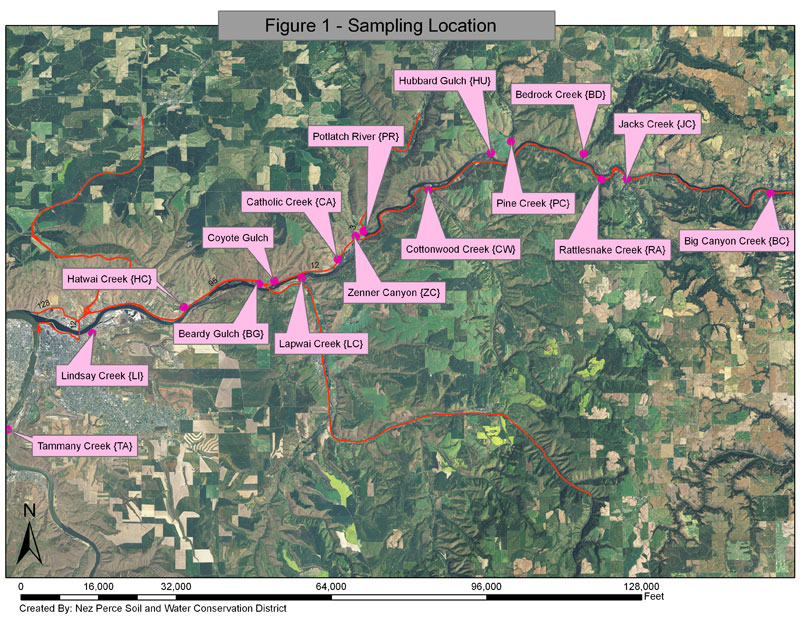
Reconnaissance-level turbidity monitoring is conducted on 16 streams within Nez Perce County (figure 1).
Turbidity monitoring is conducted in order to achieve the following objectives:
- Establish baseline turbidity conditions for 16 Nez Perce County streams.
- Determine the severity of suspended sediment inputs entering each of these streams in order to prioritize watersheds in which treatment actions could help reduce sediment loading.
- Identify the critical time period for excess suspended sediment loading to these streams.
- Identify the streams where steelhead may be negatively affected by excess turbidity during the critical time period.
Turbidity data was collected at 16 sites on a monthly basis during the period of March 2011 through January 2013 (Figure 1). Samples were taken near the mouths of the following streams: Beardy Gulch (BG), Bedrock Creek (BD), Big Canyon Creek (BC), Catholic Creek (CA), Cottonwood Creek (CW), Coyote Gulch (CG), Hatwai Creek (HC), Hubbard Gulch (HU), Jacks Creek (JC), Lapwai Creek (LC), Lindsay Creek (LI), Pine Creek (PC), Potlatch River (PR), Rattlesnake Creek (RA), Tammany Creek (TA) and Zenner Canyon (ZC).
The data is summarized in Table 2. Precipitation for the monitoring period was recorded at the Lewiston Regional Airport and gathered from the National Oceanic and Atmospheric Administration website. Missing data, shown in Table 2 is primarily due to lack of adequate flow to collect a sample, or a product of limited staff resources.
Table 2. Nez Perce County Turbidity 2011-2012 Data
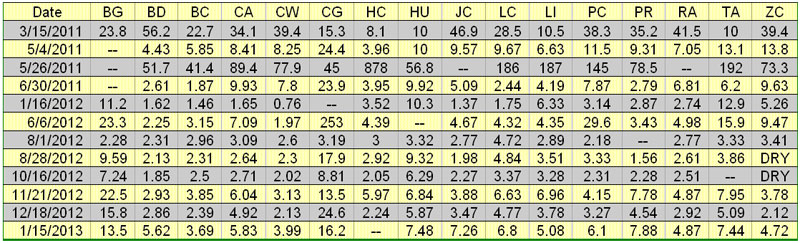
When turbidity values collected from 2011- 2012 are evaluated, the highest measurement was 878 NTU at the mouth of Hatwai Creek on 5/26/2011. All turbidity measurements from 5/26/2011 were elevated, partially due to the fact that 3.57 inches of rain were recorded that month. The three streams nearest to Hatwai Creek, Tammany, Lindsay and Lapwai Creek all registered the next three highest measurements: Tammany 192 NTU; Lindsay 187 NTU; Lapwai 186 NTU. Single instantaneous readings this high indicate that all four of these creeks can be negatively affected by suspended sediment during spring run-off.
The next highest single sample reading was 253 NTU from Coyote Gulch on 6/6/2012. Over 2 inches of rain were recorded at the Lewiston Airport during June, 2012. However, none of the other streams registered elevated turbidity on that date. Whether there was a localized storm event or other cause of this single elevated sample is unknown. A reading this high does indicate that Coyote Gulch can be negatively affected by suspended sediment.
Turbidity Monitoring Results - 2011-2012
Turbidity Monitoring Results - 2013
LAPWAI CREEK
Turbidity monitoring is performed as a component of a watershed restoration effort in the Lapwai Creek watershed. Monitoring efforts began in 2011 and are conducted at 9 sites within the watershed. Monitoring data has been summarized into the following reports:
Turbidity readings taken near the mouths of these streams reflect the cumulative effects of land management in each sub-watershed. The monitoring goal was to collect reconnaissance level turbidity data to determine the severity of sediment loading to Lapwai Creek and delineate which tributaries likely contribute the most to the total load. This information will aid in the evaluation of effectiveness of land treatment measures implemented on a sub-watershed scale, be used as an educational tool to increase landowner/land manager awareness of sediment concerns and to increase adoption of conservation measures to reduce sediment loading, and finally as a tool to determine if water quality and steelhead sediment standards are being achieved.
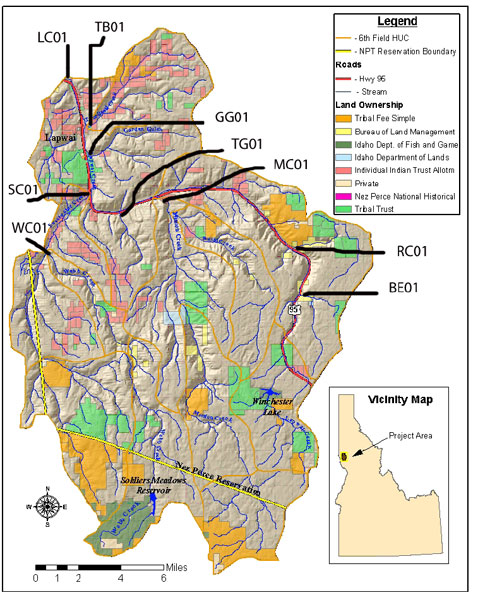
TAMMANY CREEK
Turbidity monitoring is conducted at 17 sites within the Tammany Creek watershed. The monitoring goal is to estimate the reduction of sediment loads entering the creek in this area which contribute to the Total Maximum Daily Loads (TMDL) in Tammany Creek. This information will aid in the assessment of best management practices (BMPs) implemented on a sub-watershed scale. Parameters were monitored on an instantaneous basis, with sampling occurring at least twice a month. Monitoring was completed following the Tammany Creek Monitoring Program Protocol - 2009-2010. Data collection began in 2011, is scheduled to end in 2013, and has been compiled into the following reports: