Five potential road related erosion and sediment sources were evaluated including road instability, culverts, rural road runoff, surface erosion from cropland and surface erosion from rangeland. A detailed analysis of each source is included in the Catholic Road Erosion Data Report.
Road Instability
The road instability analysis is summarized in three parts, road cuts or fills (RA), road ditch (RB), and road surface (RC) (Figure 6 illustrates location of each component within a road cross-section). The majority of instability was found in the road fill/cut areas with over 14 miles identified as needing treatment (Table 4). The remainder of treatments needed in road ditches (4 miles).
Table 4: Road instability summary of findings.
| Category | Description | Extent (miles) |
| RA | Road Cuts/Fills Needing Treatment | 14 |
| RB | Road Ditches | 4 |
| RC | Road Surfaces | 5.4 |
Figure 6: Road instability inventory locations – road cross section view.
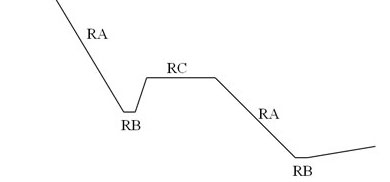
RA. Road Cuts/Fills
Road cuts and fills were inventoried for stability (shown as RA on Figure 6) and placed into one of four categories:
- Covered/Stable – Bank has vegetation growth and has no visible erosion
- Uncovered/Stable – Bank is rock or other non-vegetative cover and has no visible erosion
- Covered/Unstable – Bank has vegetation and has signs of erosion
- Uncovered/Unstable – Bank has no vegetation and has signs of erosion
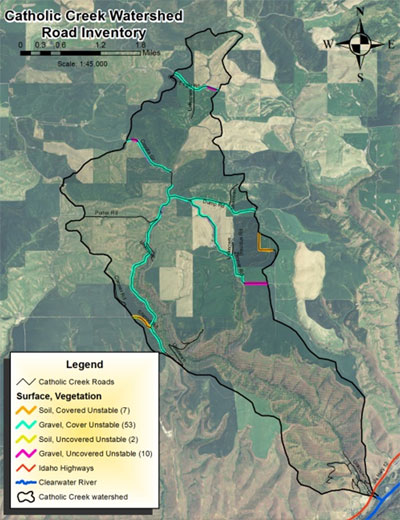
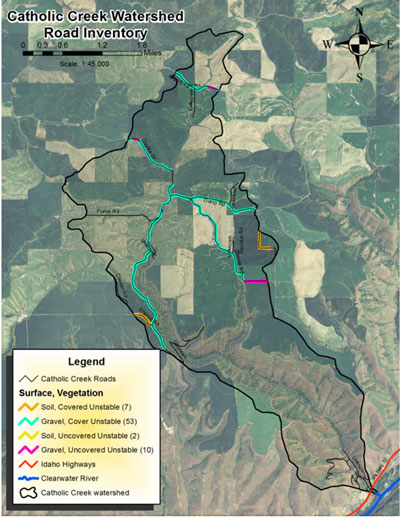
The majority of the road banks evaluated were in the covered/stable or covered/unstable categories (Table 5). The areas identified as covered/unstable and uncovered/unstable are identified as treatment areas. Treatment areas are defined as any surface in an unstable condition. Treatment areas are shown as orange, pink, and yellow lines on Figure 1.
Table 5: Road cut/fill data summary
| Vegetation | Length (miles) |
| Covered, Stable | 7 |
| Covered, Unstable | 13 |
| Uncovered, Stable | 0.6 |
| Uncovered, Unstable | 2 |
Figure 1: Cut/Fill slope inventory results.
RB. Road Ditches
Ditch conditions were measured (shown as RB on Figure 6) and placed into one of three categories:
- Stable – Ditch is maintaining its current condition
- Down-cutting – Ditch is currently showing scour
- Aggrading – Ditch is filling/trapping sediment
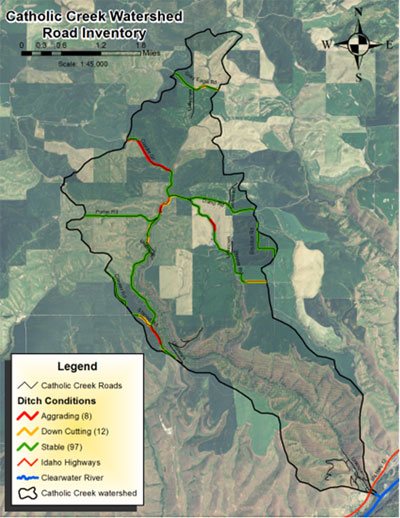
Results indicate that the majority of road surfaces are in a stable condition (19 miles) with 2 miles down cutting and 2 miles aggrading (Table 6). The areas shown as down cutting (Figure 2) are selected for treatment.
Table 6: Ditch condition summary
| Road Condition Category | Length (miles) |
| Stable | 19 |
| Down cutting | 2 |
| Aggrading | 2 |
Figure 2: Road ditch conditions
RC. Road Surfaces
Road surface were inventoried and placed in one of three categories:
- Cracking – Road is showing signs of breaking apart into small pieces.
- Slumping – Road has a medium to large dip or depression.
- Stable – Road condition is smooth and free of noticeable degradation.
- Unstable – Road surface has rills or erosion on surface
The majority of the road surfaces were stable (17.1 miles) with no miles identified as either cracking or sloughing (Table 7, Figure 3). However, 5.4 miles of unstable road surface was identified and recommended for treatment.
Table 7: Road surface condition summary
| Condition Type | Length (miles) |
| Cracking | 0.0 |
| Sloughing | 0.0 |
| Stable | 17.1 |
| Unstable | 5.4 |
Figure 3: Cut/Fill slope inventory results.
Culvert Risk Analysis
Culverts were inventoried within the watershed and their capacity and risk for large amounts of sediment entering the stream analyzed. The risk analysis indicates a hazard rating which is assigned to each culvert based on the ratio of the 50 year flow to the current culvert capacity and the fill height (Table 8).
Table 8: Culvert hazard rating descriptions.
| Hazard rating | Description |
| Extreme | Fill height is greater than 15 feet and flow ratio is greater than 3 |
| Very High | Fill height is greater than 15 feet and flow ratio is between 1.76 and 2.99; or, fill height is 15 feet or less and flow ratio is greater than 3 |
| High | Fill height is greater than 15 feet and flow ratio is between 1.25 and 1.75; or, fill height is 15 feet or less and flow ratio is between1.76 and 3. |
| Moderate | height is 15 feet or less and ratio is between 1.25 and 1.75 |
| Low | Fill height is greater than 15 feet and flow ratio is less than 1.25 |
| Very Low | Fill height is 15 feet or less and flow ratio is less than 1.25 |
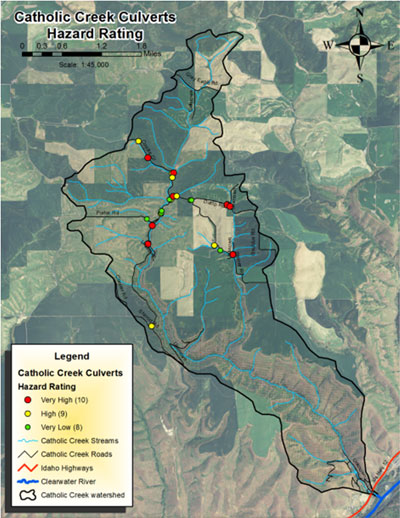
The majority of culverts inventoried presented a very low risk rating. The 19 culverts within the High to Extreme ratings are recommended for treatment and are included in the prioritized treatment sections of this report. Table 9 summarizes the findings while Figure 6 illustrates the culvert locations and risk ratings.
Table 9: Culvert risk assessment summary.
| Hazard rating | Number of Culverts |
| Extreme | 0 |
| Very High | 10 |
| High | 9 |
| Moderate | 0 |
| Low | 0 |
| Very Low | 8 |
Figure 6: Culvert inventory map with risk assessments.
Rural Road Runoff
The information collected for this section indicates the general propensity of the road segment to deliver sediment to streams. The basic assessment identifies the site conditions that are conducive for high amounts of sediment in road runoff to enter streams.
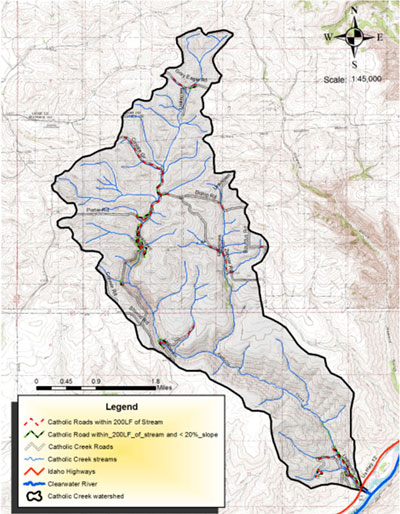
This method identifies road segments that are within 200 linear feet of the stream. These segments are the most likely to have road ditches which flow directly into a stream. In addition, the slope was considered and any road segment having higher than a 20% slope was identified.
Only road segments 200 feet or longer were considered for this evaluation. Figure 7 illustrates the locations of these areas within the watershed. A total of 6.4 miles were identified within the 200 feet zone with 2.8 miles being over 20% slope.
Figure 7: Road segments adjacent (within 200 ft) to streams. The red dashed lines show these segments. The green and black dashed lines show segments of the red that have a 20% slope or higher.